Updated 4/20/2020
The State of Colorado is publishing some really scary statistics about the coronavirus. The Department of Public Health and Environment (CDPHE) has taken it upon themselves to publish data in a very unique way and to ignore the national models for coronavirus in favor of their own. The CDPHE is predicting that more than 60,000 people will die in Colorado from the coronavirus by January 2021. They are using these predictions to make stricter and stricter shelter in place orders.
They are also posting the daily death, hospitalization rates and case rates in an extremely unique way that makes them very hard to understand. Most news sources and other national models are posting the stats from the CDPHE in a very misleading way because of the way they report them. If you were to look at the reports from Colorado it looks much worse than it actually is. The CDPHE is not hiding that they report these stats that way, but they don’t seem to be encouraging others sites to use them the right way.

Problems with reporting
First, I want to look at the reporting of deaths and cases in Colorado.
Yesterday, April 9th, the State of Colorado released that there were 33 deaths and 547 new cases of coronavirus in the state. These would be record-high numbers of both cases and deaths, except that this was not accurate information.
“The Colorado Department of Public Health and Environment said the overnight spike in deaths and new positive test results — 33 and 547, respectively — was due to large numbers of cases that are days and even weeks old being reported by counties to the state on Thursday.”
-From the CDPHE (Colorado Department of Public Health and Environment)
It turns out these cases were almost all old and did not occur yesterday. In fact, most of the numbers the state reports are old. Yet, they are released every day and counted in the national statistics as occurring that day. This causes the other models and news sources to report the stats completely wrong. It makes you wonder if other states are supplying old or misleading information?
You can see below how 9news.com reports the data:
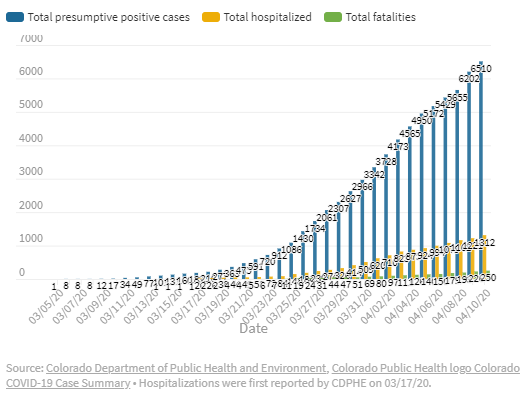
It is hard to see the graph but whenever CDPHE reports their numbers they are simply added on to this graph.
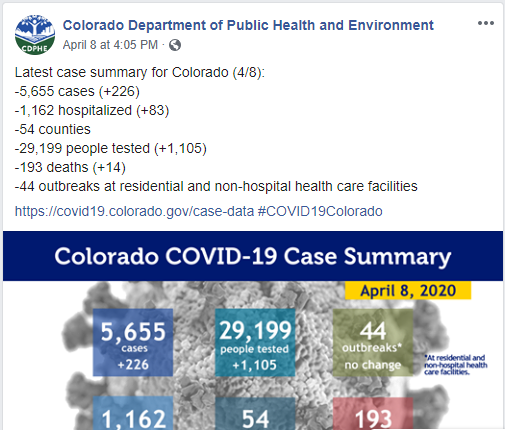
CDPHE reports them on their Facebook page the same way:
Colorado has the data for new cases and deaths, they just make it really hard to find. On the CDPHE site, they show the deaths by the day they showed symptoms if you click on the little box that says onset date and not reported date.

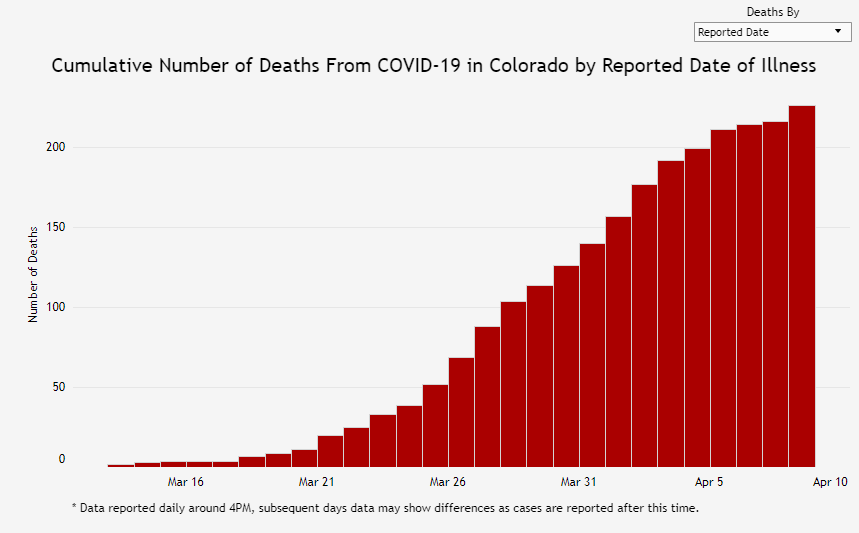
I think the reported date is the day people died? I am not sure. It appears there were 10 more deaths yesterday not 33. 2 deaths 3 days ago, and 3 deaths 2 days ago if I am reading this right. From their data, 89% of the deaths were people who were 70 or older and 79% were 80 or older.
Yes, people are dying, but not nearly as many as the state would have you believe. If you read their Facebook page it makes it look like 14 people died on April 8th, when it was only 3! They also overstate the hospitalizations and cases.
If you look at the charts below it shows the difference each day.

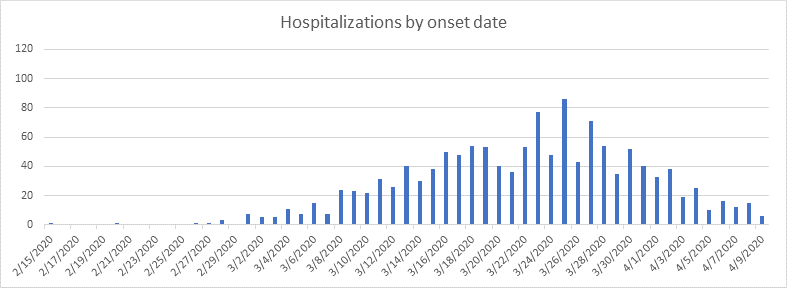
They are showing 83 new hospitalizations on April 9th on Facebook, but less than 20 on their onset chart. I still do not know exactly what the onset chart is. We can look at the “report date” chart as well.
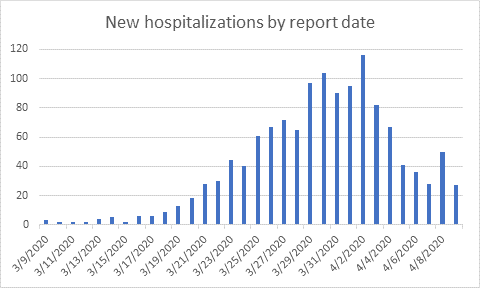
It does not come close to showing 83 new hospitalizations either! I am not sure where they are getting their data but at best it is extremely confusing. At worst it is completely wrong. You can see their charts and data here: https://covid19.colorado.gov/case-data.
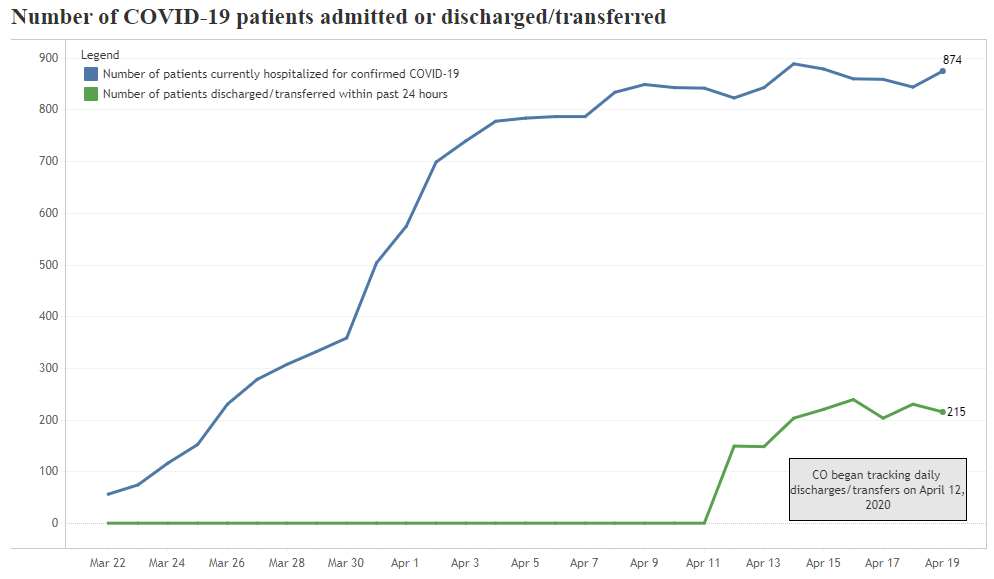
Finally, CDPHE reports there are currently more than 1,350 people hospitalized in Colorado. However, that is not true either, that is how many people have been in the hospital the entire event, not right now.
I have asked the CDPHE how we can see how many people are in the hospital or the ICU and they don’t know. They said they don’t know how to get that data. You would think that data would be important based on the models and their predictions which we will look at now.
CDPHE has started to track how many people are in the hospital now. You can see their new graph below:
Another issue is that the CDPHE keeps updating old death numbers. When you see a chart for one day, that will change the next day. I don’t mean the deaths for today or yesterday change, but the deaths for the entire chart change! Look below at the graph that compares the deaths reported a week ago compared today.
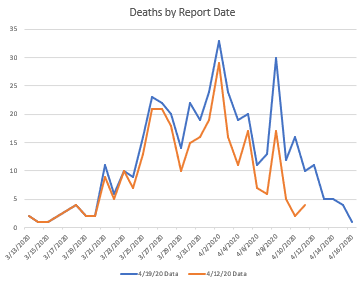
Many of the deaths being added are weeks old. I think this must be because they are getting old tests coming back positive or maybe they are reclassifying deaths that were not coronavirus originally as coronavirus now.
Colorado has some horrible predictions for the coronavirus
I also found Colorado’s updated estimates for deaths from the Coronavirus. For weeks, this data was not being shared with the public. Now, I think I know why. It is horribly outdated. They are predicting more than 60k will die at the current social distancing measures in Colorado! More than the other models are predicting for the entire country. https://drive.google.com/file/d/19ST3tRnntUGV3h7YI0tQHJDnCoL5dRE7/view?fbclid=IwAR1lVGdYHVuYWYcvv1EayrErxGvtEMr-DND6fN3sSwOKLQ33q5DRChsz3KM
This can’t be the updated version right?
I talked to the CDPHE today on Facebook and they stand by these estimates as of April 10th! I asked them why their models were so far off from other models that are showing much much lower deaths. They said their model is better because it takes into account Colorado data, while the other models are based on Wuhan data.
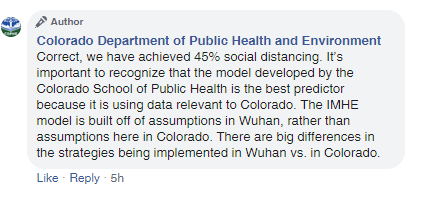
What? Why would the national models keep changing every day when new data from the United States comes in if their models are based on Wuhan data? I asked this question and they stopped replying to me. IMHE has said they are basing their models on the United States and states social distancing measures.
Here is the national model that the CDC seems to have the most faith in: https://covid19.healthdata.org/united-states-of-america
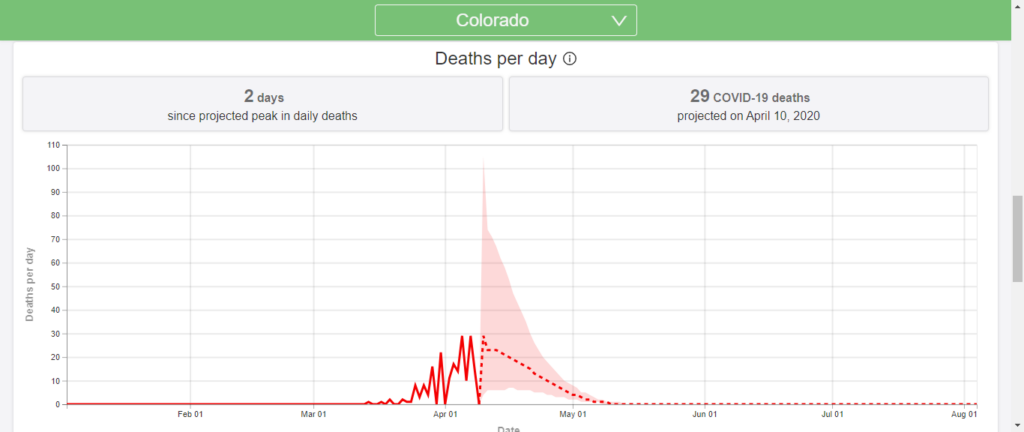
The chart above from the IMHE shows Colorado already hit it’s peak or will be very close to it. The interesting thing is that they predict this using the data from the CDPHE, which as we see is wrong. The deaths each day should be much fewer and spread out more. This model currently predicts 540 deaths in Colorado but it might be even lower if they had the right data.
Is the curve flattening?
First, finding data on the Colorado site is a challenge I have to go to Facebook and find where they link to data to find these stats. https://covid19.colorado.gov/case-data?fbclid=IwAR2iHAEK435xmp4ThO8lop3E_KLvxzwPApJp7lRRn62kXM0bt5ujMxX0f88

Does the picture above look like a flattening curve? The Colorado Department of Health would say no. This is their current prediction for cases based on different levels of social distancing.

Their chart that was published on April 6th shows exponential growth at 40 and 50 percent social distancing. In fact, they show barely any improvement over doing nothing. Yet, we are at 45% according to them now and we already saw a flattening of the curve at the end of March. In April we have seen a drastic decrease in the number of deaths and hospitalizations. Their own data is proving their models wrong, but they continue to use them.
60k deaths predicted by Colorado
This is a really scary number, but where does it come from?

This is data from the Colorado report released on April 6th. You can see at 45% we would have about 65,000 deaths by the end of the year and 20,000 deaths by June. The other site? they predict 540 deaths. That changes all the time as they get new data. Data that they get from Colorado.
Why does the Colorado model predict so many more deaths? Well, my best guess is they are using the Imperial College study from March 17th. That study predicted more than 2 million deaths in the United States and 500,000 deaths in the United Kingdom. The charts and graphs in the Colorado report are almost exactly the same as what is in the Imperial College report and they reference that report in a few places. https://www.imperial.ac.uk/media/imperial-college/medicine/sph/ide/gida-fellowships/Imperial-College-COVID19-NPI-modelling-16-03-2020.pdf
Who is right? The Imperial College study that predicts millions of deaths or the IHME group that says just over 60,000 deaths for the United States. Well, you could argue either way, except that the Imperial College study was updated on March 30th and now has predictions much closer to IHME and everyone else.
I asked Colorado Health if they have looked at that updated study and sent them the link. They will not respond. https://www.imperial.ac.uk/media/imperial-college/medicine/sph/ide/gida-fellowships/Imperial-College-COVID19-Europe-estimates-and-NPI-impact-30-03-2020.pdf
That study estimates that 7 million people in Spain already had the coronavirus on March 30th when 8,000 people had died. What is important about that? That would be .0011 mortality rate which is exactly the same as the flu. The Colorado group is predicting 1% of the entire state of Colorado will die. Their estimates are 10 times worse than the updated study they used to come up with their models assuming everyone gets it. But no study has said that everyone will get it. Their estimates are most likely more than 20 times higher than the study they are citing!
Their justification is they have Colorado data and other models don’t. Data that seems to show the exact opposite of what they claim will happen.
Conclusion
I am not the only one questioning the CDPHE data or their models. It is happening all over Facebook, Twitter, and Instagram. Yes, they have an Instagram account and so do we! Https://instagram.com/savetheeconomy. I do not know why they present the data in the way they do or why they are making the prediction they are making. Are they trying to trick us into a shelter in place for longer? Did they realize they made huge mistakes but don’t want to lose face by doing a 180? Did they spend a lot of time and effort on these studies and don’t want to admit they are wrong?
Who knows the real reason, but we do know that a shelter in place shuts down businesses and hurts people. A lot of people. There was a 53% increase in families asking for assistance from a local food bank in Colorado in March alone. Child abuse is up, substance abuse is up, people can’t pay rent, and businesses are permanently closing. If you are going to make decisions that are ruining people’s lives, shouldn’t you at least use accurate data?
Freetheeconomy,
You are misunderstanding the data that the state is publishing with regard to reading the charts by date of symptom onset. When you view the data that way, it’s going to be very rare that a person presents with symptoms (date of symptom onset) and dies on the same day. That’s why the numbers don’t change much in the 1-3 days after a persons symptoms arise.
The day reported also does not match up with their daily reported deaths on Facebook though.
The Colorado mortality estimates should be fairly accurate if you assume that 1.3% of those who catch CVD19, die from it. And you also assume that 80% of Colorado will catch CVD19 by December 2020. I find that to be a reasonable estimate assuming that we all go back to work this summer.
Recent studies show a .11% mortality rate not 1.3. That is why it is important they use updated studies
Gov. Polis is either being greatly misinformed or has his own reasons for making our state look far worse than it is. We need to lift restrictions soon or we’ll all be far worse off. Thank you for breaking down this data… What a shame!
I think he is being greatly misinformed by the CDPHE.
Thanks for the time and energy you spent to produce such a valid point of view. Discussing these issues with the forum to have dialogue is a wonderful way to defuse hysteria.
If your dependent on the government for everything you are easily controlled. It’s socialism being crammed down our throat.